Does the Minneapolis Police Department Traffic Stop Data Reveal Racial Bias?
Does the Minneapolis Police Department Traffic Stop Data Reveal Racial Bias?[1]
Disclaimer: The views and opinions expressed in this article are those of the authors.
Introduction
George Floyd’s death at the hands of Minneapolis police reignited the national debate about racial discrimination by police and led to protests across the country. Unfortunately, data on police behavior is limited; but one of the pieces of data that the Minneapolis Police Department (“MPD”) makes available can be used to determine if racial bias influences MPD traffic stops. The analysis can be used to inform stakeholders and can be continually monitored to evaluate ongoing department practices.
Summary of Results
This study analyzed Minneapolis Police Department traffic stop data from 2016 to 2020 to determine if racial bias influences MPD behavior. The Veil-of-Darkness method was used to conduct the analysis and was constructed to ensure that contextual and demographic factors are addressed. Results of the analysis showed that Black drivers are 10.8% percent more likely to be stopped during the day, when officers can observe the driver’s race for profiling, than when Black drivers’ race is not observable during darkness. The effect was highly statistically significant and demonstrated that Minneapolis Police Department traffic stops are racially biased.
Data
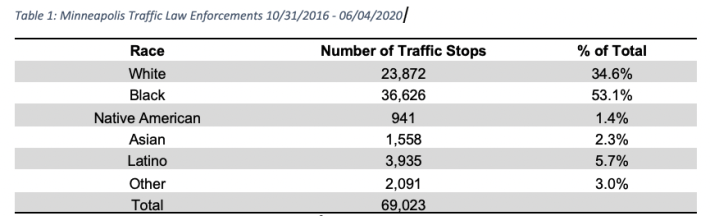
Data was obtained from the Minneapolis Police Department website[2] logging 79,000 traffic law enforcements from October 31, 2016 to June 4, 2020. Of those stops, approximately 69,000 have race captured. Below is a table showing the distribution of traffic stops by driver race. The underlying data captures Black and East African as separate races. These groups were combined for the summaries in Tables 1 & 2 to facilitate comparison to U.S. Census, but separated for the statistical analysis as to align with MPD data reporting practices.
 Data Source: Minneapolis Police Department[2]
Casual data analysis would conclude that police make racially biased decisions, because the data shows Black drivers (53.1%) are stopped much more frequently than White drivers (34.6%). While the data is suggestive, it is critical to account for demographics and other factors, such as commuting behavior and geography.
Benchmarking is the technique most frequently used to account for demographic and other factors, such as commuting patterns and driving behavior in traffic stop data (Tillyer, Engel, & Cherkauskas, 2009). This technique compares the frequency of traffic stops to the demographics of the geographic area. Below is a comparison of the racial distribution of traffic stops from Table 1 to racial make-up of Minneapolis. Demographic data for the City of Minneapolis comes from the U.S. Census Bureau and is current as of July 1, 2019 (United States Census Bureau, 2020). Note that the columns do not total to 100% because the “Other” segment has been omitted for the sake of comparison.
 * Data Source: Minneapolis Police Department[2] & US Census Bureau [3]
This analysis demonstrates that Black and East African residents made up 19.4% of the Minneapolis population, but accounted for 53.1% of the City’s traffic stops. Traffic stops with a White driver accounted for 34.6% of Minneapolis’ traffic stops, despite White residents making up 59.8% of the City’s population. These results are consistent with a previously published study by the Hennepin County Special Litigation Office (Jany, 2018). Comparison of traffic stops to the City’s demographics helps to overcome some of the previously noted shortcomings and provides some evidence of racial bias in the City’s traffic stop practices but, as stakeholders often note, other contextual factors, as mentioned above, may still not be fully accounted for.
Analysis
To analyze the traffic stop data without the need for benchmarking, economists Grogger and Ridgeway developed an alternative analytic method named the Veil-of-Darkness (Grogger & Ridgeway, 2006). The Veil-of-Darkness hypothesis states that officers stop a larger share of minority drivers during the daylight when it is easier to see the drivers race for profiling purposes than they do during the night. Limiting the analysis to the part of the day called the inter-twilight period addresses contextual factors such as commuting behaviors and geography. Different commuting behaviors, such as rush hour traffic, might confound results where police presence or certain offenses are less (more) likely to occur, e.g. speeding, than non-rush hour traffic. Because sunset varies throughout the year, it randomizes any geographic effects ensuring they do not influence results. Together, the method gets to a controlled set of drivers based on driving habits across Minneapolis with the only varying factor being the presence of daylight.
The inter-twilight period is between 5:05p.m. and 9:41p.m. The times relate to the day in December when it gets dark the earliest and the day in June when the sun sets latest. Below is a graph showing all traffic stops made by Minneapolis police from 10/31/2016 to 6/4/2020 with each dot representing a single traffic stop. Traffic stops highlighted in red occurred during the inter-twilight period and are the focus of the analysis.
 * Data Source: Minneapolis Police Department[2]
The Veil-of-Darkness method creates a natural experiment using the setting of the sun – in daylight police can more easily identify a car driver’s race than they can at night. If the data shows that a larger share of Black drivers are stopped during daylight than at night, there is evidence of racial bias in the practices of the police. Because the time at which the sun sets differs during the year, factors such as commuting behavior, police presence, and underlying criminal activity are effectively randomized in the sample and do not impact the results. As a result, any difference identified by the analysis is exclusively due to the officer’s ability to perceive race using available daylight.
Below is a graph showing the share of Black drivers pulled over across thirty-minute segments of time during the inter-twilight period.

* Data Source: Minneapolis Police Department[2] and authors’ calculations
The chart shows the share of all traffic stops that include a Black driver during daylight and darkness. This is done by grouping all traffic stops into half-hour windows. The first set of data points, labeled 5:30 p.m. on the horizontal axis, show that 51.2% of traffic stops during the daylight included Black drivers while 49.4% of traffic stops during darkness involved a Black driver. Differing sunset times throughout the year make this comparison possible because sometimes during the year it is dark at 5:30 p.m. and other times it is light at 5:30 p.m. Further analysis shows that Black drivers are stopped more frequently during daylight in nine of the ten timeframes. The comparison reveals that Black drivers are consistently stopped more frequently during daylight when officers can see the car driver’s race than in darkness. This visual is an important first step in the Veil-of-Darkness method but leaves two unanswered questions:
1) How large is the disparity?
2) Is the disparity statistically significant?
Grogger & Ridgeway and subsequent researchers have used regression modeling to both quantify the difference in stop rates and determine statistical significance. As discussed previously, the Veil-of-Darkness method ensures that demographic and contextual factors are adequately addressed and only three pieces of data are required to complete the analysis – time of the stop, date of the stop, and the driver’s race. In addition to the primary analysis, sensitivity tests are an important component in the process. Sensitivity tests are done to ensure that small changes to model specification do not have a large impact on the model’s results. Researchers including (Grogger & Ridgeway, 2006), (Ritter & Bael, 2009) have done this by adding a third time factor to the regression equation. Results of the regression modeling and sensitivity testing are provided below in Table 3. The figures below reflect the increase in traffic stop rates for Black drivers between darkness and daylight – positive numbers reflect an increase in traffic stops during daylight.
 Using MPD data from 2016 to 2020, Black drivers are 10.8% percent more likely to be stopped during the day when officers can observe the driver’s race for profiling than when the Black driver’s race is not observable during darkness. As noted, the effect is highly statistically significant with a 2% probability or less of occurring randomly. Sensitivity tests using step & spline functions for time demonstrate that the results do not materially change from specification changes, further enhancing confidence in the results.
Conclusion
Because of its ability to address contextual, demographic, and other factors, as well as the low data requirements (only time of the traffic stop, date of the traffic stop, and driver’s race are needed), the Veil-of-Darkness method is becoming a go-to method for traffic stop research. Results of this study are largely in line with a 2009 study that used data from the Minneapolis Police Department and the Veil-of-Darkness method (Ritter & Bael, 2009). That study used traffic stop data from 2002, concluding that Black drivers were 5.5% – 7.0% more likely to be pulled over during daylight than at night.
Together, the results of this study and previous studies demonstrate racial bias against Black people in the traffic stop practices of the Minneapolis Police Department. This study demonstrates that racial bias against Black drivers exists, based on the most recent data (including 2020); when the results are compared to similar previous studies, the racial bias appears to have increased in recent periods.
References
Jeffrey Grogger & Greg Ridgeway, Testing for Racial Profiling in Traffic Stops From Behind a Veil of Darkness, 101 J. of Am. Stat. Ass’n 878-87 (2006).
Joseph A. Ritter & David Bael, Detecting Racial Profiling in Minneapolis Traffic Stops: A New Approach, Cura Reporter 11-17 (2009).
Libor Jany, Hennepin County report finds stark racial disparities in traffic stops, Star Tribune (Oct. 5, 2018), https://www.startribune.com/hennepin-county-report-finds-stark-racial-disparities-in-traffic-stops/495324581/.
Rob Tillyer, Robin S. Engel, & Jennifer Calnon Cherkauskas, Best Practices in Vehicle Stop Data Collection and Analysis, 33(1) Policing: An International Journal 69-92 (2010).
U.S. Census Bureau: Quick Facts, U.S. Census Bureau, http://www.census.gov/quickfacts/fact/table/minneapoliscityminnesota,US/PST045219 (last visited June 10, 2020).
[1] Joseph Schneider, D.B.A. recently completed his doctoral studies specializing in behavioral economics. His research has focused on asset pricing and criminal justice.
Alfred Ndungu, Ph.D. is a statistician whose previous research has focused on statistical theory and healthcare.
[2] http://opendata.minneapolismn.gov/datasets/police-stop-data/data
[3] https://www.census.gov/quickfacts/fact/table/minneapoliscityminnesota,US/PST045219